Blog · 6 MIN READ
How does Big Data Predict Failures?
Posted on September 29
Data efficacy is extremely situational. It is both critical and meaningless. When applied correctly it is the most precious resource you have and can affect every decision you make, from which potato chips you buy at the store to when you take an asset down for maintenance. We are increasingly a society that collects, analyzes and uses data to manage decisions. As information systems become more powerful and sophisticated, our ability to gather data has outstripped our ability to use it well; that being said, strategies exist to use data as intended in an industrial application: to predict failures before they happen.
How Big is Big?
Great, but how does that work? The term “Big Data” is an apt one; we are collecting and collecting; historicizing and storing. At the risk of invoking a tautology, Big Data is, well, big. Digitized information doesn’t take up much space—technically, it doesn’t take any space; only the means of storing it exists in the physical world. Data lives in ones and zeroes; in the digital realm. And with this data, we can predict the future.
Like all predictions, there are outliers. Things happen that cannot be predicted, or have their own probabilities to consider, like natural disaster, pandemics and plain old human error. But all things being equal, all this data gives us the closest thing to a working crystal ball to ever exist. This does not happen magically, but scientifically. Teams of data scientists work to develop accurate models of the maybe and might. We’ll get into specifics below, but in essence, the process is: Input, Model, Analyze, Surmize and Act.
About Data
Before you can begin to harness Big Data, it is important to get a few things straight about its nature. Data is just information, which can be either good or bad. Now, this is a bit obvious, but you want good data. So how do you know if data is good? First, it’s accurate. If the collector doesn’t work right or colors the results, you’ve got bad data. It must also be complete; you want comprehensive data, as much detail as is necessary to predict what you want to know. If a rotor fails due to heat, but you’re only collecting RPMs, your partial data is effectively bad data. The closer you can get to gathering all information from every asset, at every point of failure within that asset, the closer you are to extremely accurate modeling.
Aside from accuracy and relevance, you must also consider timeliness: data that becomes available after an event is good to have (as we’ll discuss below), but predicting requires a real-time flow of information to analuze against a historical or statistical context to be helpful. If you don’t have the information you need at the time of a decision, Big Data hasn’t helped at all.
Data must also be freely available to analyze. Now, we’re not suggesting you should put your proprietary information on Reddit, but if some information is on your system and some is on a thumb drive in your middle desk drawer, you won’t have a complete picture. And even though you know that data is there, whatever is analyzing it probably doesn’t. In essence, siloed information doesn’t help; it hurts.
About Methods
So, assuming your Big Data is also Good Data, the next steps are to model and analyze. This is where the data scientists, formulae and algorithms come into play. The methods for modeling and analyzing are often extremely complex. To outsiders, they are a mystery: information goes in on one side and predictions come out on the other.
We tried to bribe some data scientists to teach us their secrets, but they held to their ancient code of silence. Ok, that’s misleading. There are numerous resources available to learn exactly how data scientists model events and how systems use analytics to forecast problems, they are just too lengthy to dig into in this already lengthy blog. What we can do is provide two general categories of how things happen, both of which effectively utilize Big Data:
Regression: This is the “normal” way of forecasting. Statistical analysis using data to predict a problem, with things as “simple” as linear regression models to multivariate adaptive regression models. Very simple.
Machine Learning: Programs that learn as humans do. By knowing what has led to failures in the past, they can learn to predict them in the future by identifying similar conditions or pattern recognition. Machine learning is another one of those very complex things beyond the scope of this blog, but that’s the general idea.
There are combinations of these methods and various things that might make an expert disagree with the broad categorization, but for our purposes, they serve.
So, data goes in, calculations are made, and a prediction comes out. Based on the information available and the models and analysis, that bearing can run another X units-of-time before failure. Or, based on what’s happened in the past, that bearing is going to fail within X units. It’s obvious how important good data is to this process. But so too is failure.
Fail to Succeed
It’s worth pointing out that to be able to predict a failure, you need data on past failures. This is actually a pretty common problem: we haven’t been collecting data for long enough to be able to accurately predict some kinds of failure, especially for parts that last a very long time. This can be compensated for by using OEM specs and tolerances, but the best thing to know is the PF Interval: the time between the point of detection of potential failure (P) and the point of actual failure (F). This is expressed in a curve:
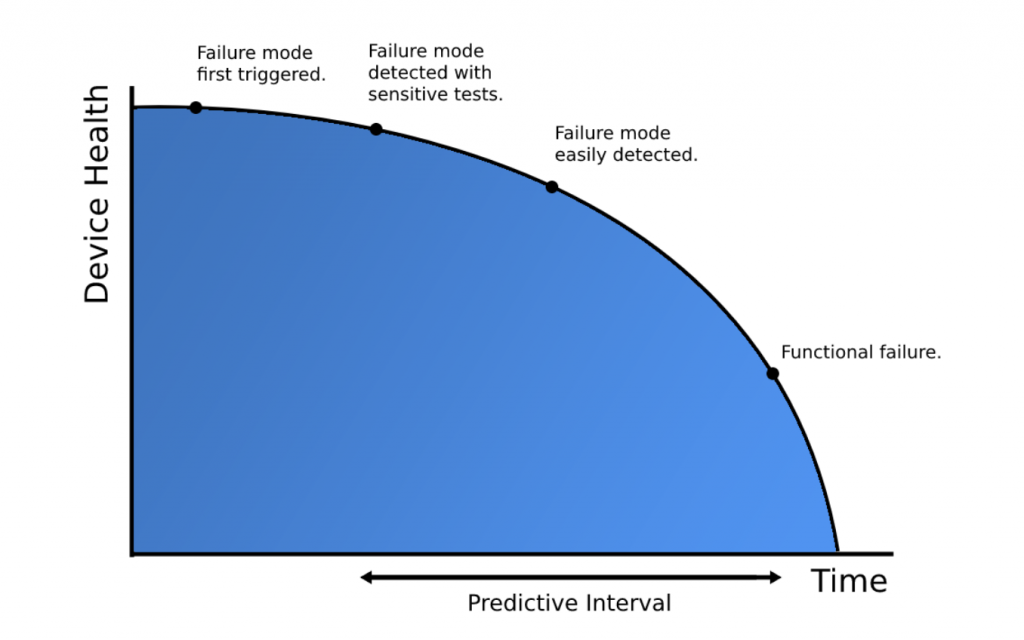
The more data we collect about the PF Interval, the better our ability to forecast failure becomes. This blog asked the question “How does big data detect failures?,” and this curve is ultimately the answer. By understanding the condition of the asset in relation to the PF Interval, we are able to predict failures long before they happen and take action to prevent them.